What is driving the upturn in Graduation Rates in Doña Ana County?
What can record-breaking 2020 graduation rates tell us about equity, academic success, and career readiness? |
|
|---|
|
The COVID-19 pandemic impacted students across the nation. School closures and the shift to online learning created unprecedented challenges as families and students adjusted to their “new normal.” The pandemic exposed the severity of the digital divide for low-income students, students of color, and those living in rural areas. Lack of internet access, home computer equipment, and computer literacy limited students' academic success.(1) Despite these challenges, graduation rates
continued to break record highs through Doña Ana County, New Mexico, and nationwide.
This edition delves into 4-year high school graduation rates at the local and state levels. We examine interesting demographic trends in the data, discuss credit recovery programs and their relation to academic success, and consider alternative measures of academic success and career readiness.
|
|
|---|
|
 |
Doña Ana County and Statewide
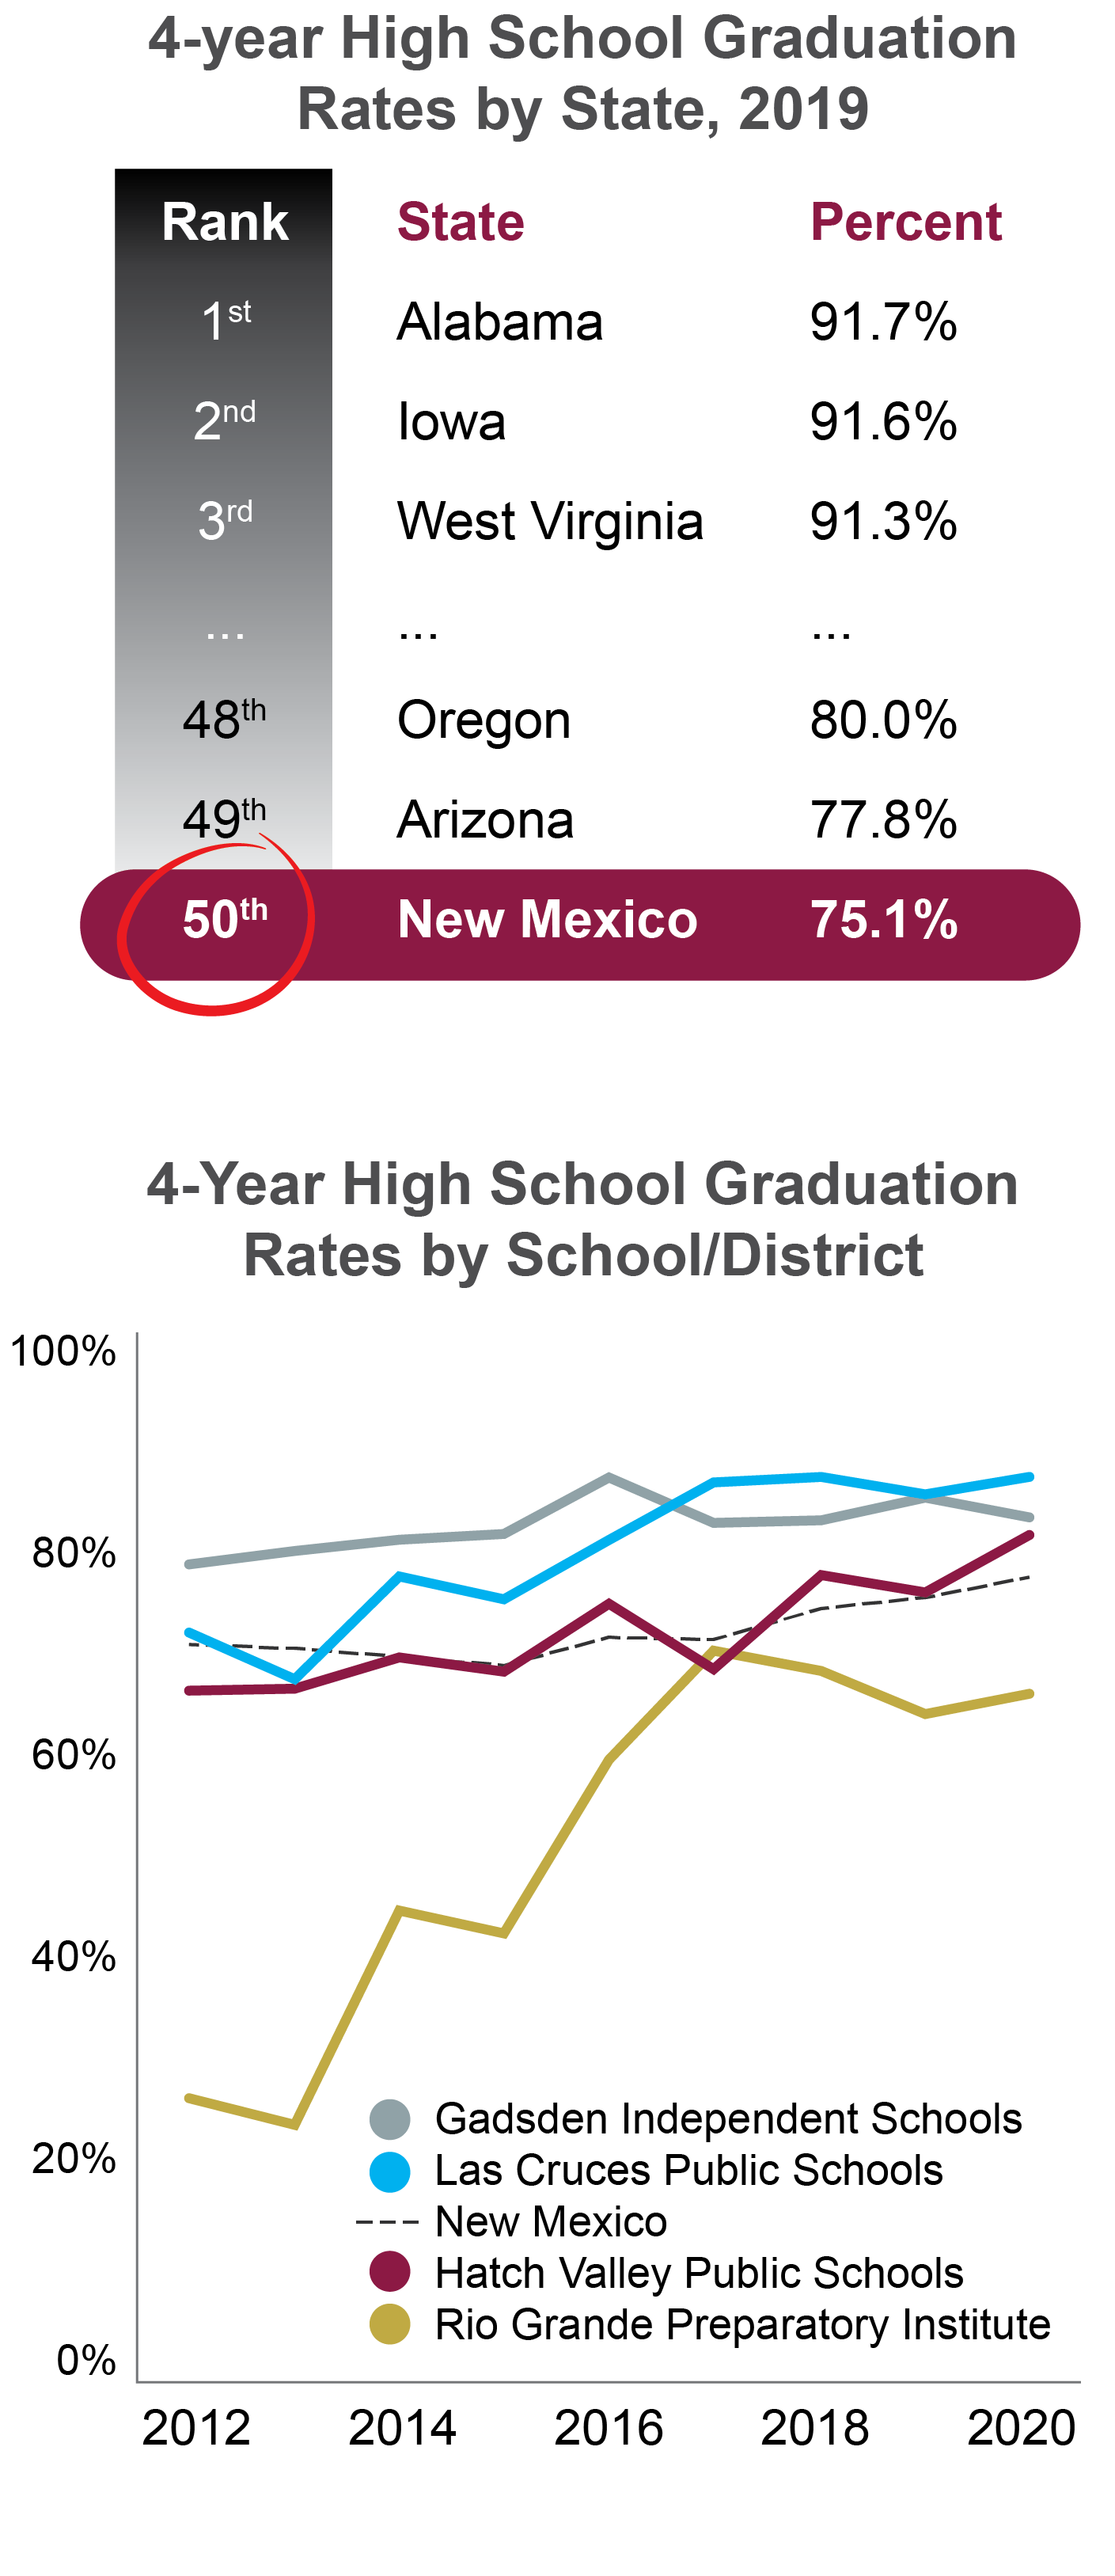
Newly released data shows 4-year high school graduation rates for New Mexico (NM) rose to 76.9% in 2020, the highest rate the state has ever seen and an increase of 1.8% from 2019. Although this marks an improvement, NM ranked last in the nation in 2019, and it remains to be seen whether NM will rank higher in 2020.(2) In Doña Ana County, all three school districts exceeded the statewide graduation rate in 2020.
Since 2012, both Las Cruces Public Schools (LCPS) and Hatch Valley Public Schools (HVPS) have seen 4-year graduation rates rise by about 2% per year on average, while the rate for Gadsden Independent School District (GISD) has increased by about 1% per year. Rio Grande Preparatory Institute in Las Cruces has seen some of the most dramatic changes in 4-year graduation rates with an average annual increase of 6% since 2012, although the growth rate has slowed in recent years. These trends indicate a slow but steady upturn in high school students graduating in the standard four years. See our dashboard for more information.
|
|
|
|
|
Graduation Rates by Student Characteristics |
|
|---|
|
While the changes in 4-year graduation rates in New Mexico and Doña Ana County are impressive, it is essential to look at the characteristics that the students embody which might affect graduation rates, including language, disability status, and socioeconomic status.
|
|
|---|
|
English Language Learners (ELL) in Las Cruces
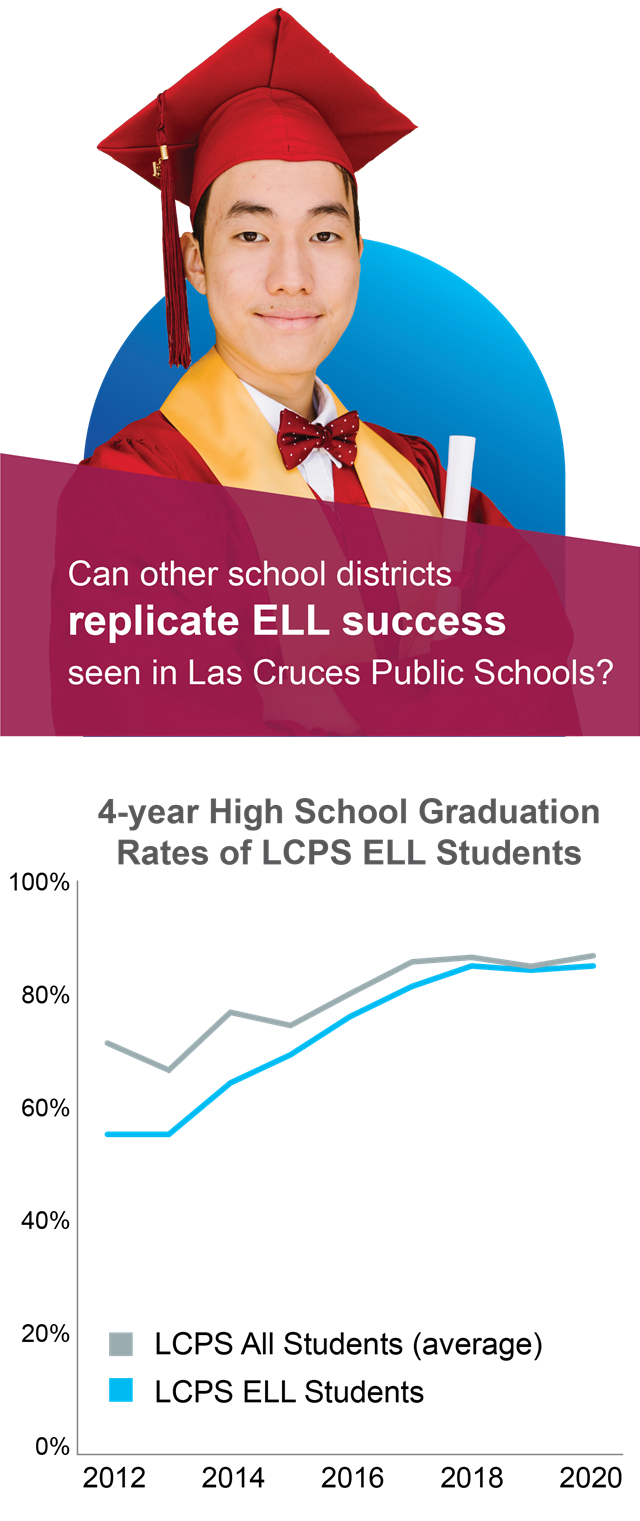
In Las Cruces Public Schools, the gap in 4-year graduation rates between English Language Learner (ELL) students and all students has virtually disappeared. In 2012, graduation rates for ELL students were 16 percentage points below the LCPS average; in 2020, rates for ELL students were only 2 percentage points below average. ELL students in Las Cruces defy existing research that suggests English-learner students in the United States are less likely to graduate in four years.(3)
Why are ELL students graduating at exceptional rates in Las Cruces Public Schools, and can other school districts replicate their success? One study found that ELL students who have meaningful relationships with their peers and teachers may be more likely to participate in class and perform better academically and less likely to drop out of school.(4) Perhaps Las Cruces Public Schools has found a way to increase engagement among ELL students.
|
|
|
|
|
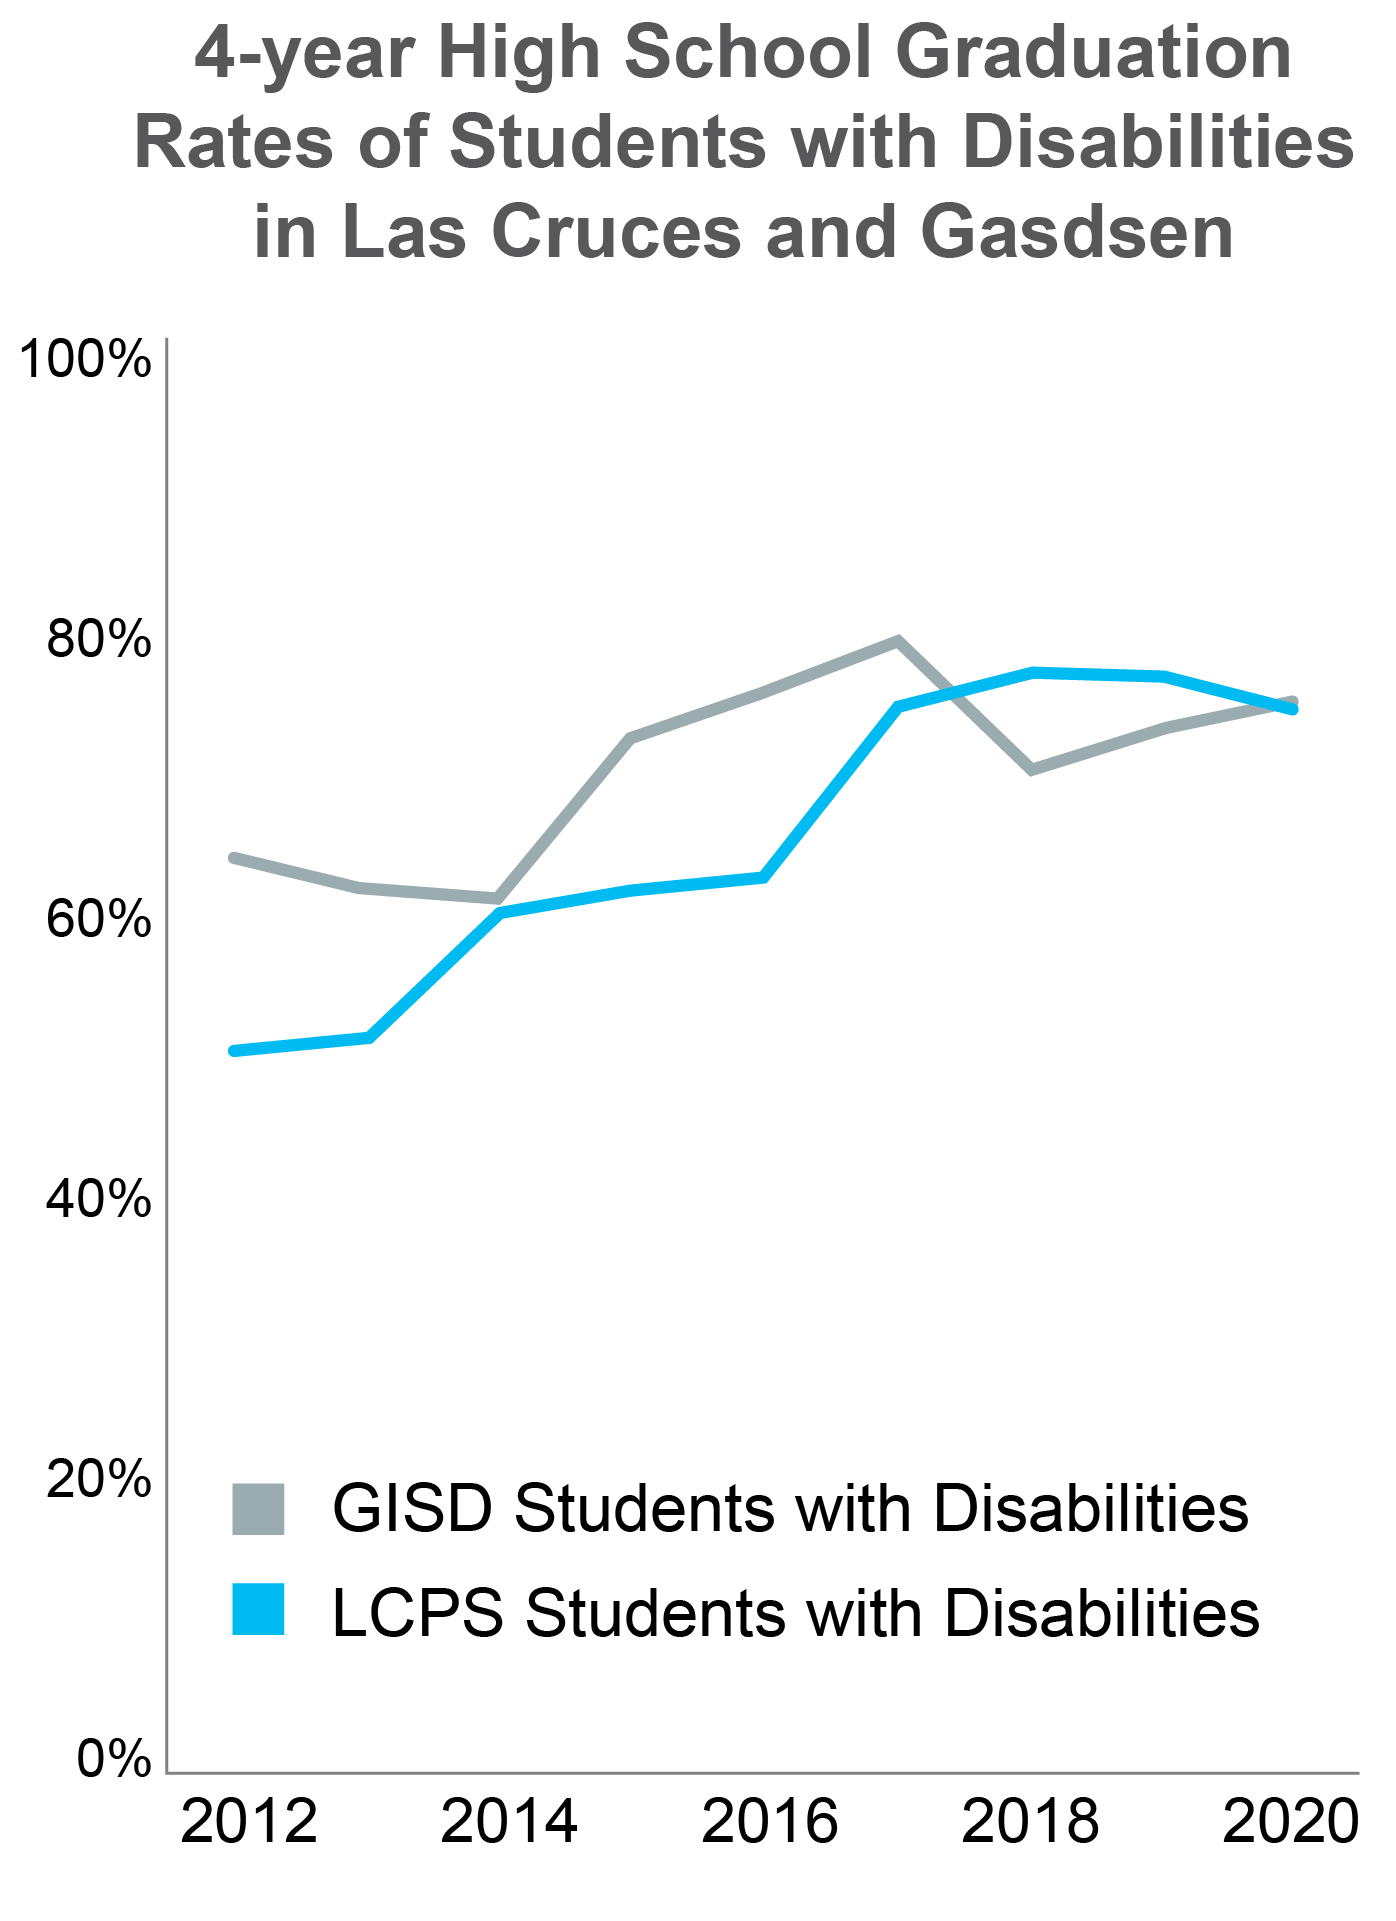
Students with Disabilities (SWD) in Las Cruces and Gadsden
Approximately 1 out of 7 students in Doña Ana County have been identified as students with disabilities (SWD). (5) In Las Cruces Public Schools, 4-year graduation rates for SWD increased faster than average compared to the total student body between 2012 and 2018. However, recent graduation rates for SWD appear to have slowed. In 2018, the 4-year graduation rate for SWD in LCPS was 77%. In 2020, that rate was 74%. We see similar trends in Gadsden. It is imperative to track whether these downward trends continue. |
|
|
|
|
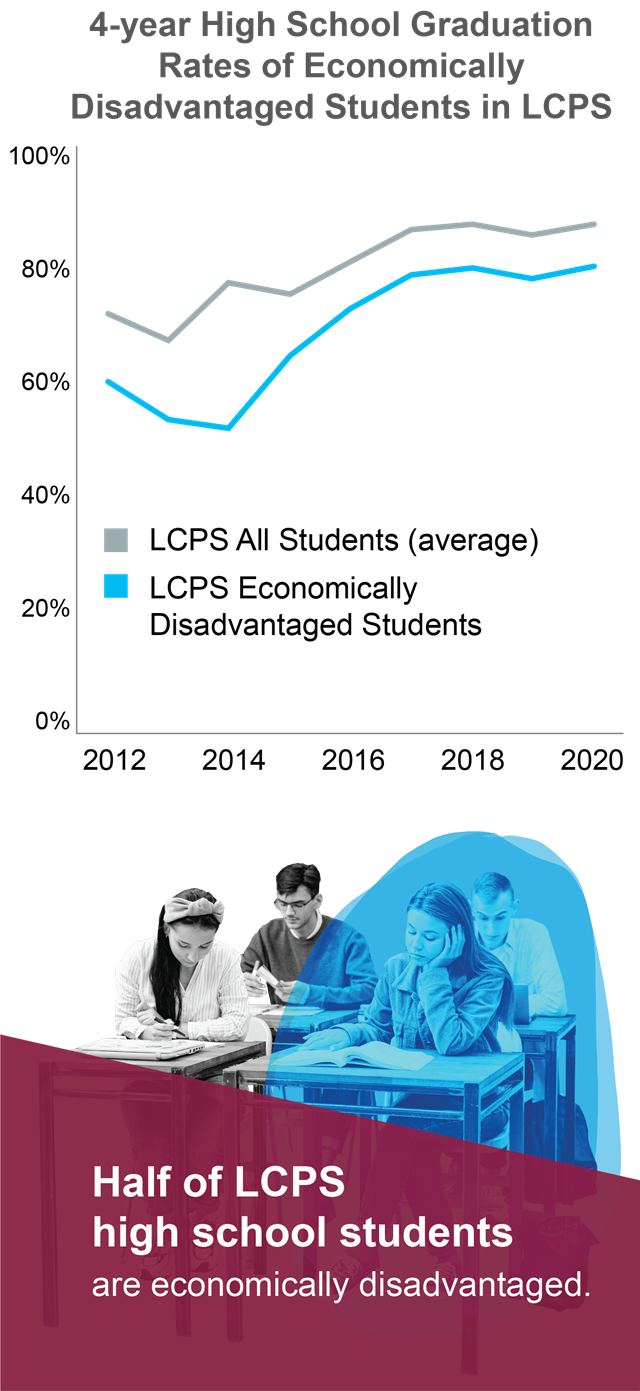
Economically Disadvantaged Students
Approximately half of high school students in LCPS are economically disadvantaged. While 2020 graduation rates for economically disadvantaged students in LCPS were far higher than 2012, they may have reached a stalemate. Since 2016, 4-year graduation rates for economically disadvantaged students in LCPS have consistently fallen 7% to 8% below the student body average.
These persistent gaps may be due in part to computer and internet access. Approximately 1 in 5 households in the district boundaries of LCPS, and roughly 2 in 5 households in HVPS and GISD, did not have internet subscriptions before the pandemic.(6) The digital divide in computer and internet access is more profound in low-income households (with annual income less than $20,000).(6) Currently, efforts to increase broadband access are occurring on a state and local level.
|
|
|
|
|
Credit Recovery, Graduation Rates, & College Readiness |
|
|---|
|
While increasing graduation rates are certainly worth celebrating, some question what is contributing to these changes. There is an ongoing debate about the role of high school credit recovery strategies in increasing graduation rates. Credit recovery is a strategy to help students who have failed a class earn credit by retaking it using alternative methods. The purpose of these programs is to help struggling students regain good standing before graduation without repeating a year.(7)
|
|
|---|
|
The debate lies in the academic quality and standards of credit recovery courses. Research has shown that credit recovery programs target low-income students and students of color to get at-risk students on track towards graduation. Credit recovery that maintains academic rigor can benefit students needing a second chance. (7) However, for schools that relax their standards, credit recovery may become an alternate route to graduation. |
|
|
|
|
Standardized test scores (e.g., PARCC, ACT, or SAT) do not reflect the same upward trends that graduation rates across the state have shown, suggesting that students are not improving academically. Additionally, the number of students enrolled in college remedial classes has increased. According to the NM Higher Education Department, over one third of high school graduates in New Mexico find themselves in remedial college courses.(8) Students who take even one remedial course are less likely to graduate.(9) New Mexico requires students who need remedial courses to take them at community colleges. Data from Doña Ana Community College shows that in 2019, 92% of students were placed in Developmental Math or English courses.(10) This data suggests that although students are graduating at increasing rates, they are unprepared for entry-level college courses.
|
|
|---|
|
"What other ways can we measure academic success for high school graduates?" |
|
|---|
|
There is still crucial work to be done supporting students' learning and academic success, which will help bridge the gap in graduation rates. As national graduation rates continue to hit record highs, understanding the contributing factors becomes increasingly essential. Schools with high credit recovery participation also have the highest graduation rate increases. (11) Without more data and transparency into contributing factors for these increased rates, many still question the role of credit recovery in improved graduation rates.
What other ways can we measure academic success for high school graduates? Perhaps we should account for additional factors when predicting students' career or college readiness, such as those in the list below (12)(13):
- Non-cognitive assessments
- Participation in early childhood education
- 3rd Grade Reading scores
- Completion of Algebra I in 8th grade
- 11th Grade English scores
- Student growth(14)
- GPA in high school
- FAFSA completion rates
- Level of classroom engagement (e.g., attendance, milestone assignments, midterm performance)
- Number and type of early alerts from teachers and staff
To understand student achievement and predict future academic or workforce success, we must first evaluate how these factors are measured. In other words, it is critical to understand what graduation rates can and cannot tell us and investigate possible causes of trends in the data that place struggling and underserved students at a disadvantage to their peers. Only then can we take action to support those students and bridge the gap. |
|
|---|
|
|